Counters are a Prometheus metric type whose value only goes up, and which represent cumulative total counts like "How many requests have we handled in total?" or "How many seconds have we spent handling requests?". Since the value of a counter depends on the initial (re)start time of a process that tracks and exposes it, the absolute value of a counter is almost never useful. So before graphing or doing anything else with a counter, you typically want to wrap it in a function like rate(), irate(), or increase() to see how fast the counter is going up.
The exact behavior of those three functions is a frequent source of confusion, so in this post we will look in detail at each of them, and how they deal with counter resets and do extrapolation of data to give you a final value. Note that we will only look at the above-mentioned counter-related functions here. If you want to track the increase or decrease of a gauge metric, you will need to use the delta() or deriv() functions for that instead. We will cover those in a future blog post.
Overview
Here's a high-level overview of the difference between the three functions for calculating the rate of increase of a counter:
rate(): This calculates the rate of increase per second, averaged over the entire provided time window. Example:rate(http_requests_total[5m])yields the per-second rate of HTTP requests as averaged over a time window of 5 minutes. This function is the most common, as it yields a nicely smoothed rate with a predictable per-second output unit.irate()("instant rate"): This calculates the rate of increase per second just likerate(), but only considers the last two samples under the provided time window for the calculation and ignores all earlier ones. Example:irate(http_requests_total[5m])looks at the two last samples under the provided 5-minute window and calculates the per-second rate of increase between them. This function can be helpful if you want to make a zoomed-in graph show very quick responses to changes in a rate, but the output will be much more spiky than forrate().increase(): This function is exactly equivalent torate()except that it does not convert the final unit to "per-second" (1/s). Instead, the final output unit is per-provided-time-window. Example:increase(http_requests_total[5m])yields the total increase in handled HTTP requests over a 5-minute window (unit:1 / 5m). Thusincrease(foo[5m]) / (5 * 60)is 100% equivalent torate(foo[5m]).
All three functions share the requirement that they need at least two samples under the provided range window to work. Series that have less than two samples under the window are simply dropped from the result.
How exactly to calculate the increase given a fixed time window and some data points falling under that window is a matter of tradeoffs and imperfect approximations. Prometheus chooses an approach that aims to provide the most correct answer on average, given only the limited data under the provided window. Let's look in more detail at how it does this:
Extrapolation of data
What frequently confuses people is the extrapolating behavior of the rate() and increase() functions. As an example, increase() can return non-integer results like 2.5883 even for counters that only have integer increments. The reason is that increase() tries to approximate the increase of a counter over the total duration of the specified time window (e.g. 5 minutes in the case of increase(foo[5m])). But in reality the first and last samples found under the time window will never coincide 100% with the start and end of the provided time window. Thus increase() (and also rate()) extrapolate the slope between those first and last data points under the window to the window boundaries, to arrive at a value that will on average be closer to the expected increase over the entire window (had there actually been samples precisely at the window boundaries).
The following diagram shows an example of using rate() with a 1-minute window and samples that are 15 seconds apart, with one actual counter increase by 1 happening under the window:
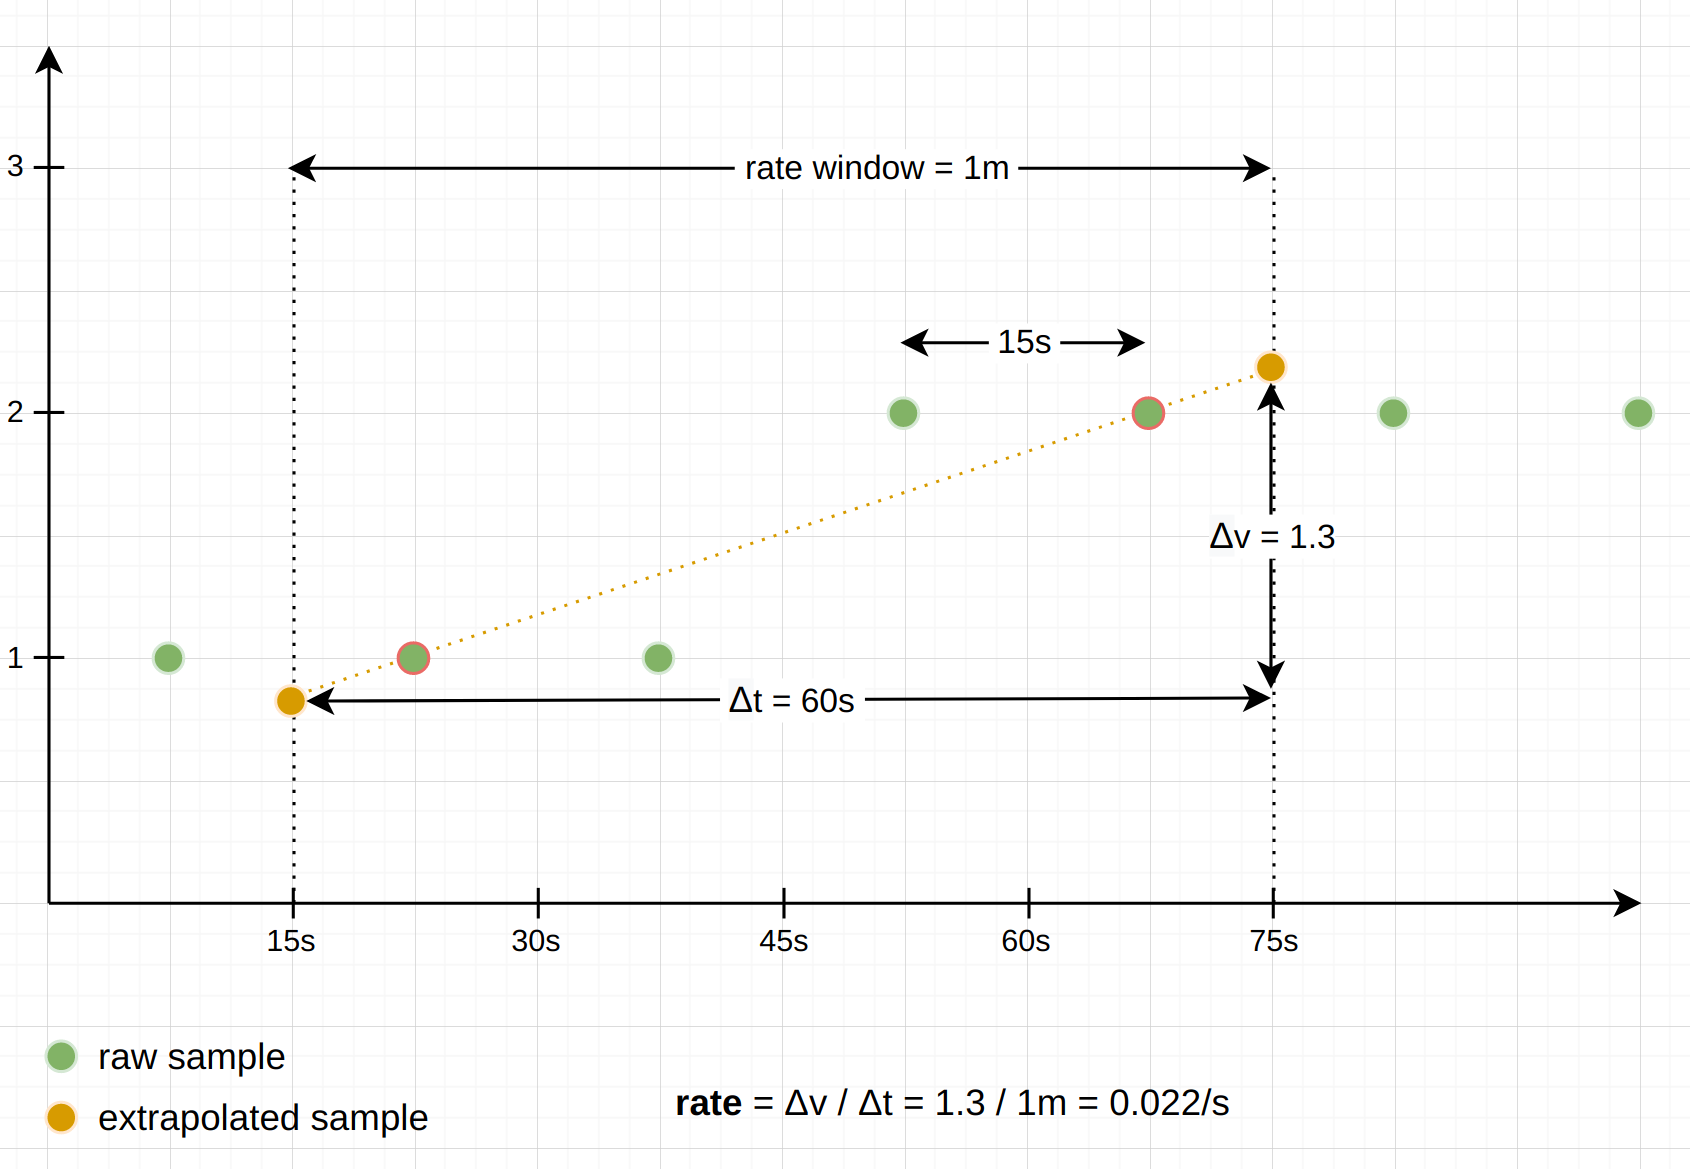
As you can see, the reported result is based on the slope between the first and last sample (almost true, see the next section about counter resets) under the window, and extrapolated to the window boundaries.
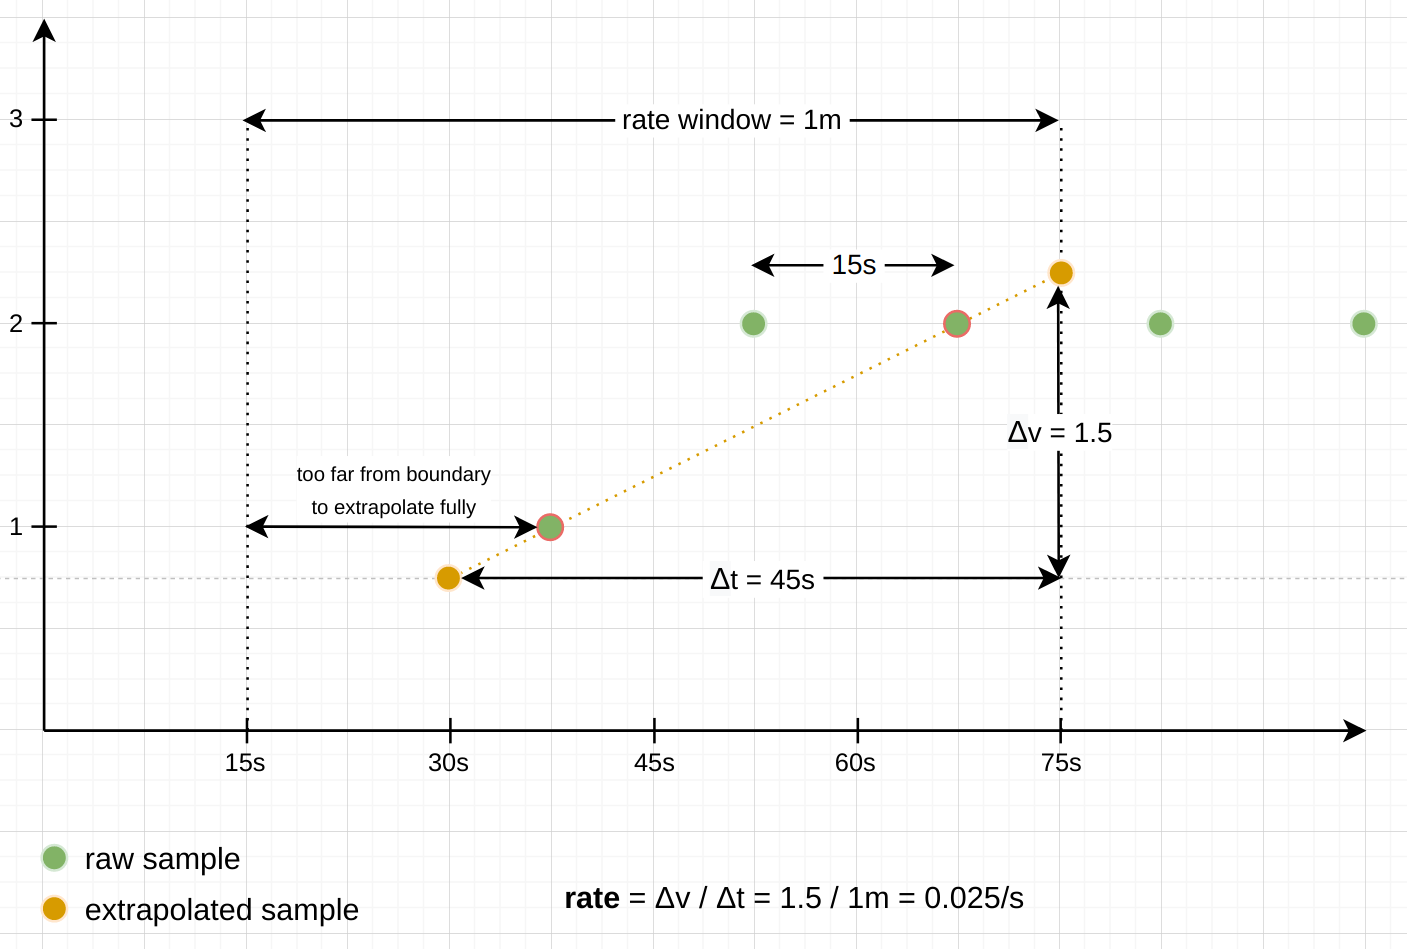
Note: There are some exceptions to this extrapolating behavior: When a series looks like it starts or ends under the provided time window, we do not want to extrapolate too far into the direction in which the series terminates. The rate() and increase() functions guess that a series starts or ends under the window when the first or last sample is farther away from its respective window boundary than 1.1x the average interval between the samples under the window. In that case, the extrapolation only extends half an average sample interval toward the window boundary, but not all the way. Similarly, the functions avoid extrapolating to a negative value, since counters always start at 0 and can never be negative. Instead, the extrapolation only happens until the expected 0 value is hit.
Since irate() really only looks at the per-second increase between two samples, it does not do any of this extrapolation.
Dealing with counter resets
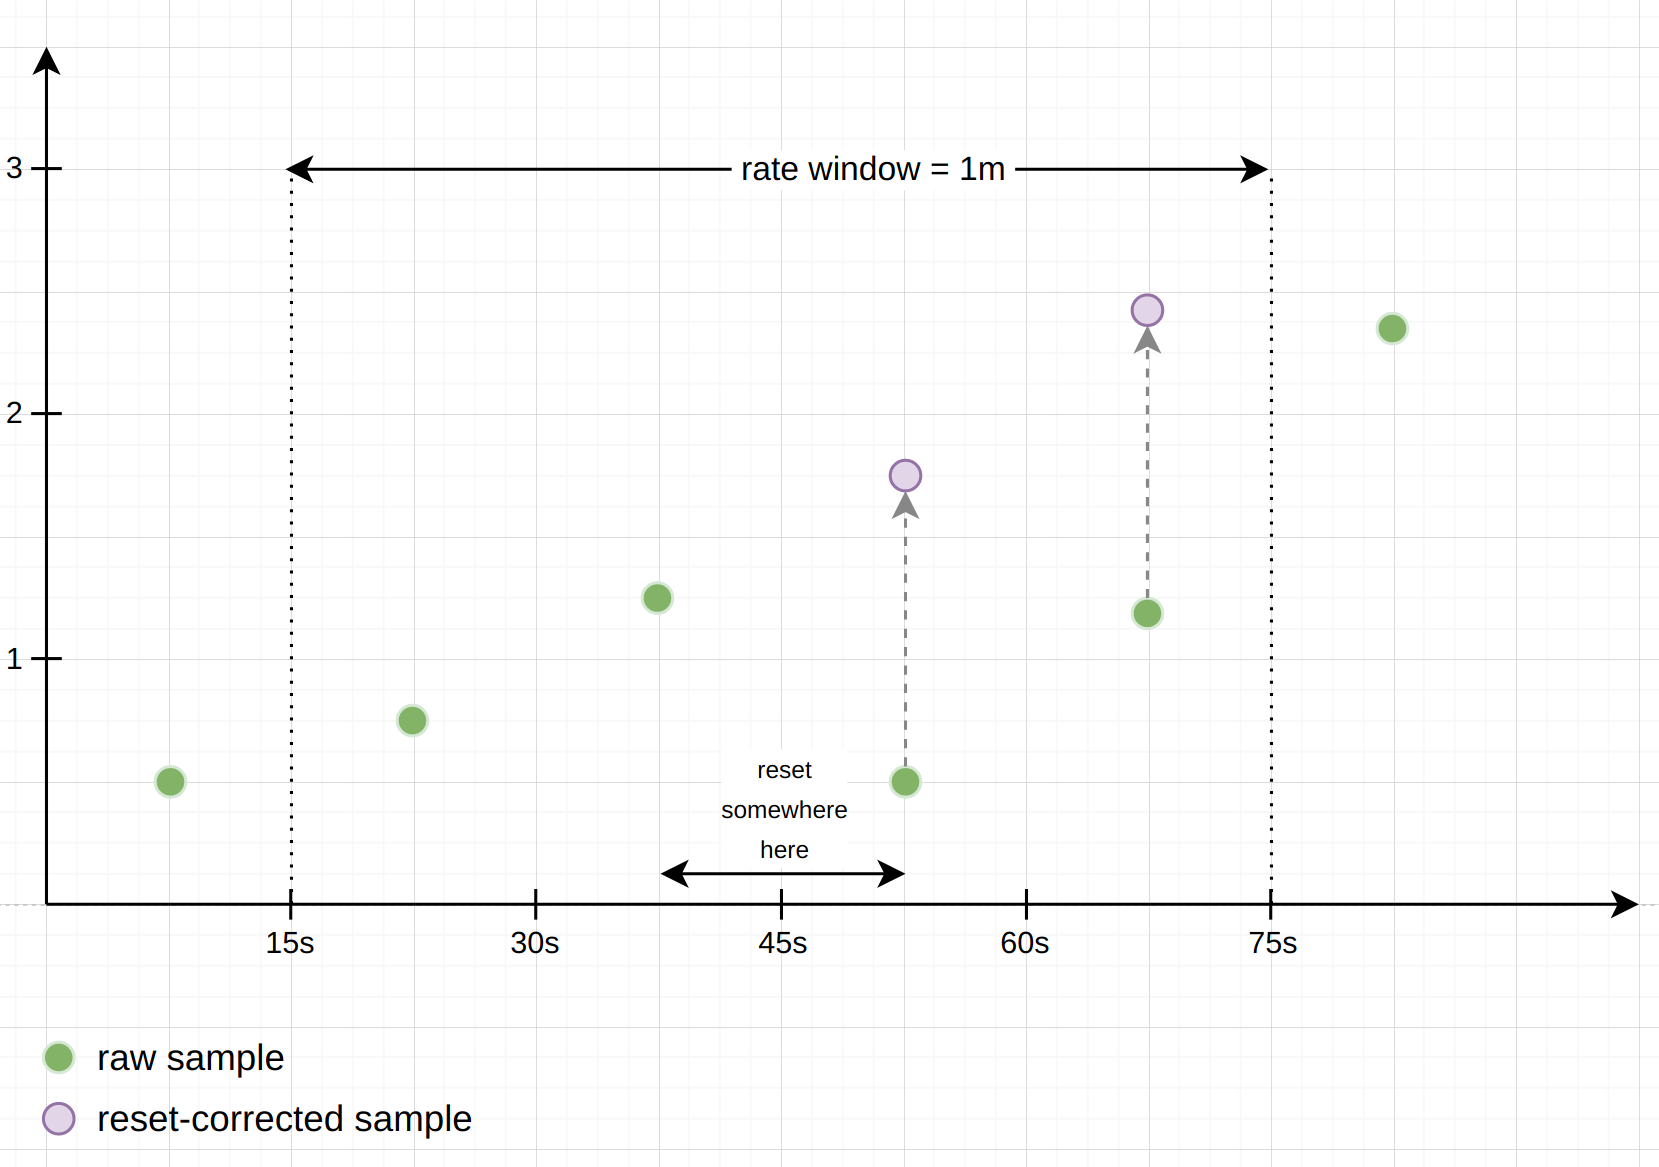
Although counters normally only go up, they reset to 0 whenever a process that tracks them restarts. To not interpret these resets as actual negative rates, the counter-related functions have logic to detect and deal with those resets: when iterating over the samples under the provided time window, the functions check whether any sample has a lower value than the previous one, and interpret this situation as a counter reset. Using the further assumption that counters always start at 0 after a reset, these functions then just add the new sample value to the previously seen one, to compensate for the reset.
The following example diagram shows how a rate() calculation deals with a counter reset happening under the provided window. You can imagine this as rate() creating a set of "virtual" samples from the underlying "real" samples. The final rate is then calculated from the virtual samples, as if the resets had never taken place:
Note: Whenever a counter resets, there is the chance that it was incremented after Prometheus's last scrape, but before the reset. Those increments are lost to Prometheus forever, and there is no way to get them back. To minimize this effect, resets should happen only once in a while, and much less frequently than Prometheus scrapes your target.
Conclusion
The inner workings and exact outputs of the various counter-related functions in PromQL can be confusing. In this post we aimed to shed light on how the rate(), irate(), and increase() functions deal with units, counter resets, and extrapolation. Hopefully this will give you a better understanding of their subtle behaviors.
If you want to understand more about Prometheus and PromQL, you may also want to take a look at our Prometheus training courses, especially our Understanding PromQL training.
Comments powered by Talkyard.