Yesterday, the Prometheus Team released Prometheus 2.26. While there are many changes in this release, let's take a look at some of the most relevant new features for users:
New PromQL editor
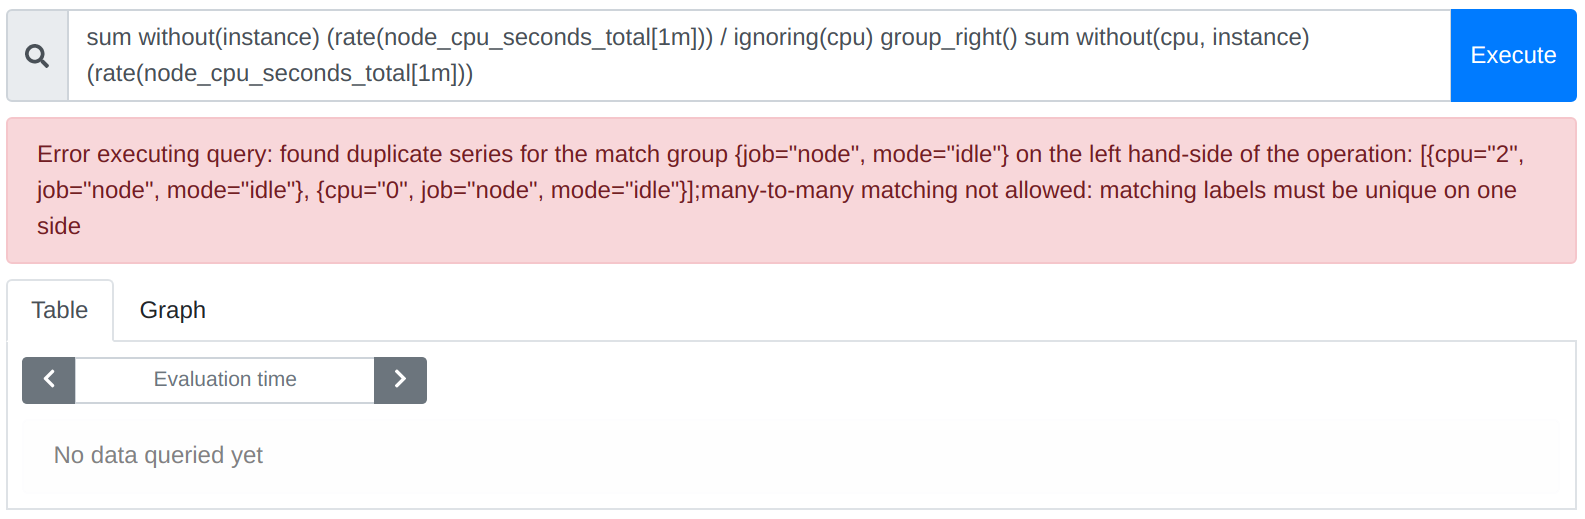
Since the creation of Prometheus in 2012, the built-in PromQL expression editor has just been a simple text input field with no syntax highlighting and almost no autocompletion functionality or other code intelligence features. This has meant that working with PromQL in Prometheus was a lot of guesswork and pain:
Julius Volz from PromLabs (that's me!) has long collaborated with Augustin Husson from Amadeus on building new PromQL editor functionality with support for syntax highlighting, contextual autocompletion, as well as inline linting of expression errors. Up until now, this new editor functionality has only been available in the PromLens PromQL expression builder and explainer tool by PromLabs. For Prometheus 2.26, we worked to bring this new editor functionality to Prometheus itself and hope that this will greatly improve people's PromQL experience:
The new editor is still experimental for this release, so you have to turn it on explicitly by enabling the "Use experimental editor" checkbox. In later releases, we expect it to become the default.
In case you are curious, the new editor functionality is powered by a set of open-source libraries and tools:
- CodeMirror 6 as the underlying editor provides a fantastic modular and customizable editor as a base.
- The PromLabs lezer-promql library module implements a client-side grammar and parser for PromQL.
- The codemirror-promql extension for CodeMirror 6 uses the parse tree from
lezer-promqlto build code intelligence features like contextual autocompletion and linting on top of it.
While we spent a lot of energy on getting the new editing features right, they are probably not 100% perfect yet. So please do file bugs or help us improve the code if you find any issues. Also, we encourage other projects and vendors to reuse this PromQL editor in their software and help us maintain it. Let's build the best PromQL text editor together!
If you would like to understand and edit PromQL even better, check out PromLens, which goes far beyond the PromQL text editing experience and provides advanced insight, analysis, and builder features for anyone working with the query language.
Experimental trace exemplars support
Metrics such as the ones that Prometheus collects provide a good aggregate view of a system, while traces (such as systems like Jaeger or Grafana Tempo collect) allow you to dive deep into the details of a single request. This allows you to inspect where it failed or how much time it spent in various stages.
Often it's useful to be able to jump from request metrics to correlated traces. For example, in a Prometheus histogram metric that shows a lot of slow requests, you may want to quickly find a request with such high latency, to debug why it is slow.
Exemplars aim to solve this by letting a service expose example trace IDs along with its metrics. For example, in OpenMetrics, the new standard for Prometheus-style metrics exposition, histogram bucket series may be annotated with trace IDs by providing the trace ID in a comment after the series value, like this (see the OpenMetrics specification for details):
# TYPE foo histogram
foo_bucket{le="0.01"} 0
foo_bucket{le="0.1"} 8 # {} 0.054
foo_bucket{le="1"} 11 # {trace_id="KOO5S4vxi0o"} 0.67
foo_bucket{le="10"} 17 # {trace_id="oHg5SJYRHA0"} 9.8 1520879607.789
foo_bucket{le="+Inf"} 17
foo_count 17
foo_sum 324789.3
foo_created  1520430000.123
When enabled using the --enable-feature=exemplar-storage flag, Prometheus now has support for storing exemplars in memory and retrieving them for PromQL queries via a new HTTP API. This feature was added by Callum Styan from Grafana Labs and can be used by tools like Grafana to jump between metrics and traces, as already demonstrated by Grafana Labs last year.
Going from metrics to relevant exemplars is a complex topic. For more details, see the Prometheus exemplars design document as well as the pull request adding them to Prometheus.
New and experimental PromQL features
Prometheus 2.26 added a few new PromQL features, one of which is experimental and needs to be explicitly enabled:
Getting the last data point in a specified time range
The new last_over_time() function returns the last sample value for each series in a range vector. This can occasionally be helpful as an explicit way to override the 5-minute vector selector staleness behavior for unreliable data sources.
For example, to get the last seen resident memory value for any container in the last hour, you could query for:
last_over_time(container_memory_rss[1h])Note that in the usual case, data points that you still care about at a given query evaluation timestamp should be coming in regularly and freshly enough (even if their values haven't changed) that a normal vector selector (e.g. container_memory_rss) should be sufficient. If used without care, last_over_time() may return samples for series which you no longer care about.
Getting the numeric sign of input series
The new sgn(v instant-vector) function returns the numeric sign (0, 1, -1) for all series in an input vector:
sgn(my_vector_of_positive_and_negative_numbers)Clamping an input vector into a given range
The new clamp(v instant-vector, min scalar, max scalar) function allows you to constrain sample values to be between a minimum and a maximum value (this is a shorthand for using clamp_min() and clamp_max() after another):
clamp(my_vector, 0, 100)Negative offsets
As an experimental feature (enabled via --enable-feature=promql-negative-offset), you can now enable support for negative offsets that move selected future data to the present time:
my_metric offset -1hMost people should only ever need positive offsets, but occasionally (see the discussion in the issue regarding this) negative offsets may be useful.
AWS SigV4 authentication support
In December of 2020, AWS announced their Amazon Managed Prometheus (AMP) service that offers a cloud-based Prometheus service based on a Cortex backend. Prometheus can normally write natively to cloud-based Prometheus services like this via its remote_write integration, which supports a number of standardized HTTP authentication schemes.
However, AWS uses its own authentication mechanism, Signature Version 4 (SigV4), to handle any and all authentication to and between AWS services. Prior to Prometheus 2.26 you had to proxy any remote_write requests through a special proxy sidecar that could add SigV4 authentication to outgoing samples sent to AMP. Now in 2.26, Robert Fratto from Grafana Labs added native support for SigV4 to Prometheus, so you can write samples directly from any Prometheus server to AMP. This makes using Prometheus with one of the largest cloud providers as a backend much easier.
Conclusion
A lot has happened in Prometheus 2.26 to make it easier to use, allow new use cases, and make it interoperate better with other systems. Go try it out now!
Comments powered by Talkyard.