Today, the Prometheus Team released Prometheus 2.33. While there are only a few completely new features, this release promotes multiple important experimental features to a stable state. It also improves on existing functionality in Prometheus. Let's take a look at the most interesting changes:
PromQL queries can now officially look into the future
For the longest time it was a simple-to-remember truth that PromQL expressions could only look into the past, relative to their overall evaluation timestamp (whether that was a single timestamp such as in an instant query or a set of subsequent timestamps at regular resolution steps of a range query). As covered in our blog post about data selection behavior in PromQL, the underlying reason for this was that both instant and range vector selectors were only ever allowed to look backwards from their evaluation timestamp and could never look into the future, and there are no other constructs in PromQL that select data from the TSDB.
This officially changes now with the release of Prometheus 2.33, which stabilizes two experimental PromQL features that break this law:
Anchoring selectors to absolute timestamps via the @ modifier
A few years ago already, Prometheus 2.25 had introduced an experimental @ modifier that allows anchoring a selector such as mymetric or mymetric[5m] to an absolute timestamp, e.g. mymetric @ <mycustomtimestamp> or mymetric[5m] @ <mycustomtimestamp>. With this modifier added to a selector, the selector looks back relative from the provided absolute timestamp, rather than from the current resolution time step. A post on the Prometheus blog covered the reasoning for this feature in more detail, with the prime use case being the ability to show a stable topk() result over an entire graph range. Until now, this experimental feature had to be explicitly enabled via a flag.
In Prometheus 2.33, the @ modifier was declared stable and is now always enabled. This means that anyone who wants to cache PromQL query results needs to take into account that results for past evaluation timestamps are not necessarily fixed anymore, since queries may select future data, which may still change as data points are actually coming in for that time range.
Looking into the future with negative offsets
Back in 2.26, Prometheus added the experimental ability to add negative offsets to vector selectors. Up until now, this feature had to be enabled using a flag to allow writing selectors like mymetric offset -10m that select data from 10 minutes in the future relative to the evaluation timestamp. Without this feature, you were only allowed to write positive offsets that looked backwards.
Prometheus 2.33 now marks this feature as stable, removing the need for a feature flag and thus introducing a second permanent PromQL feature that allows a query to look into the future.
Remote write receiver marked stable
While Prometheus is primarily a pull-based monitoring system, there are occasional use cases for pushing data to a Prometheus server from a remote-write-protocol sender (often this will be another Prometheus server, as sending data via remote write requires some level of data pre-processing and batching to work as intended). Prometheus 2.25 originally added support for a remote write receiver in the Prometheus server itself, but it was still marked experimental and had to be enabled using the feature flag --enable-feature=remote-write-receiver.
Prometheus 2.33 now promotes this remote write receiver feature to stable as well, guaranteeing that it will not be removed from Prometheus (at least until Prometheus 3.x happens one day). Since the remote write receiver allows changing the Prometheus server's state over the network, you will still need to explicitly enable it with a command-line flag, which is now called --web.enable-remote-write-receiver.
Better performance and search UI for targets, service discovery, and alerts pages
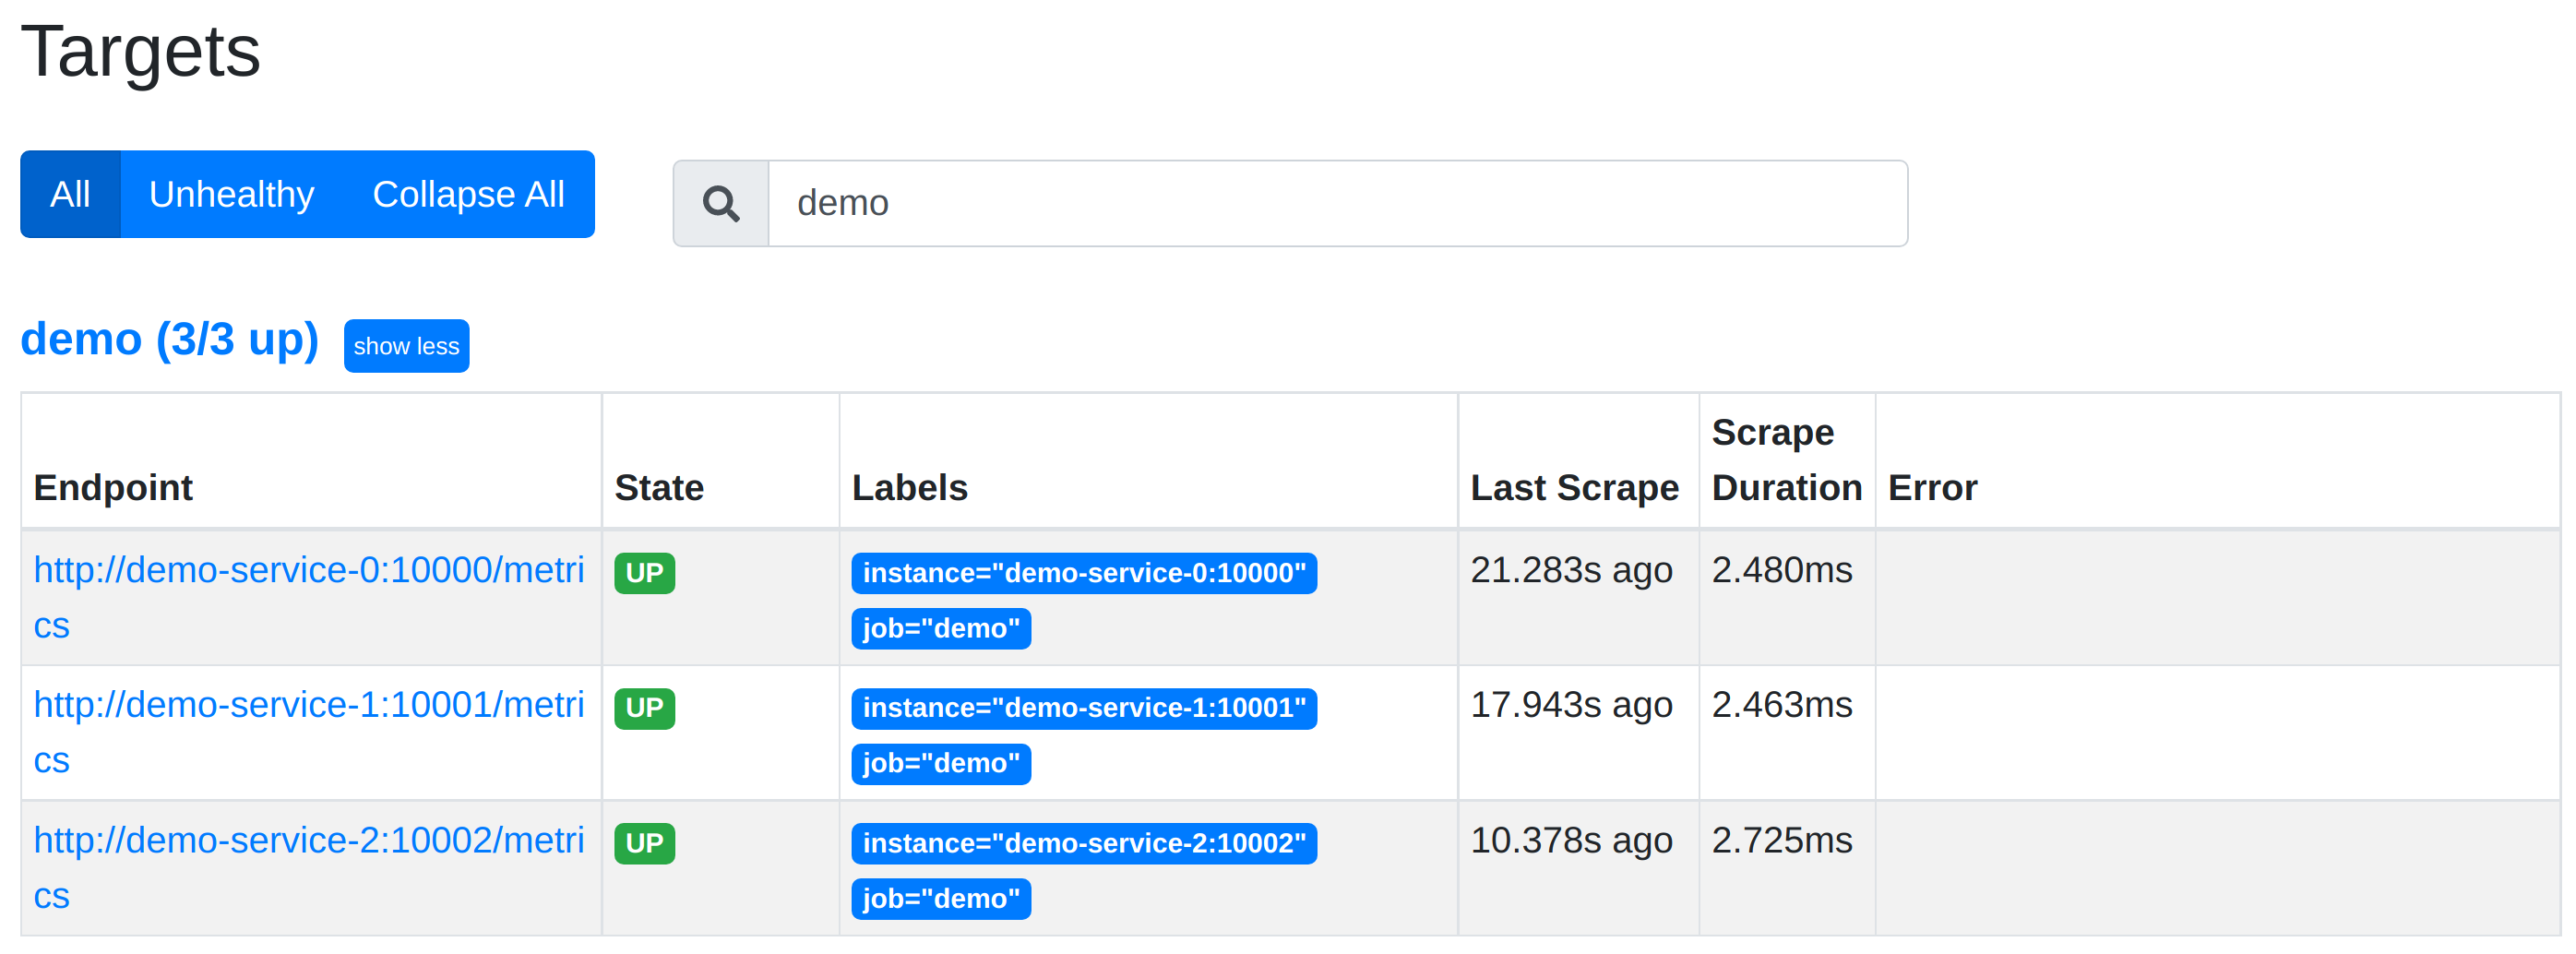
In the React UI that was introduced a few years ago, the rendering performance for the /targets, /service-discovery, and /alerts pages could sometimes get really slow when a Prometheus server had thousands of targets or alerting rules configured that needed to be shown. Prometheus 2.33 makes rendering for these pages much faster by not showing all items upon the initial page load, but introducing infinite scrolling with on-demand rendering when item lists exceed a certain length. With this change, these pages load much faster for large setups now.
One downside of not rendering all list items at once is that this hurts full-page searchability using <Ctrl>+F. To still make it easy to search in the target and alert lists, Augustin Husson also added a search bar to the top of those pages that allows filtering of the shown results:
Other enhancements
There are a lot of other improvements in Prometheus 2.33, such as better cardinality analysis in promtool, a new template language function, new Kubernetes service discovery features, enhanced efficiency of the remote write and TSDB layers, and plenty of smaller bug fixes. To see the full list of changes, check out the Prometheus 2.33.0 release changelog.
Conclusion
Prometheus 2.33 promotes a couple of interesting features to the stable level and adds a lot of enhancements around performance, both on the UI side and the server side. Go try it out now!
Comments powered by Talkyard.