Today, the Prometheus Team released Prometheus 2.39. The main highlights are a new experimental TSDB feature that allows appending old or out-of-order data, as well as major improvements in resource usage. Besides that, there are a number of small enhancements and bug fixes. Let's take a look at the most interesting changes:
Experimental out-of-order ingestion
Prometheus' own time series database (TSDB) normally has two restrictions:
- Within a given time series, samples can only be appended in timestamp-based order, so an older sample cannot be ingested when there is already a newer sample for the same series.
- Within the TSDB as a whole, samples can only be appended that are at most one hour older than the newest sample in the TSDB.
While this usually works fine for live monitoring use cases, occasionally you might have metric producers which need to ingest out-of-order data or data older than one hour. This may be because the producer is not always connected to the network, needs to aggregate data over a longer period of time before sending it, or similar constraints. On a technical level, such producers can expose custom client-side timestamps in the metrics exposition format or use the remote write receiver in Prometheus to override Prometheus' own scrape timestamp. However, Prometheus' TSDB does not normally accept such samples when they are out of order or too old.
Prometheus 2.39 now adds an experimental feature to allow these producers to send out-of-order data or data older than one hour. You can enable this by setting the out_of_order_time_window setting in a new tsdb configuration file section to a non-zero value. For example, to allow out-of-order and late appends for up to one day, you could add the following to your prometheus.yml:
storage:
  tsdb:
    out_of_order_time_window: 1d
Note that this feature is still EXPERIMENTAL (despite not requiring a feature flag), so it may still change or be removed in the future in case there are major issues.
Under the hood, this feature required implementing functionality in the TSDB to deal with the creation of TSDB blocks containing out-of-order data when needed, as well as enabling the merging of out-of-order data in queries. You can find the full details and the discussion around this feature in the GitHub feature request issue, the implementation design document, and finally the pull request to implement it, which multiple developers worked on collaboratively.
Resource usage improvements
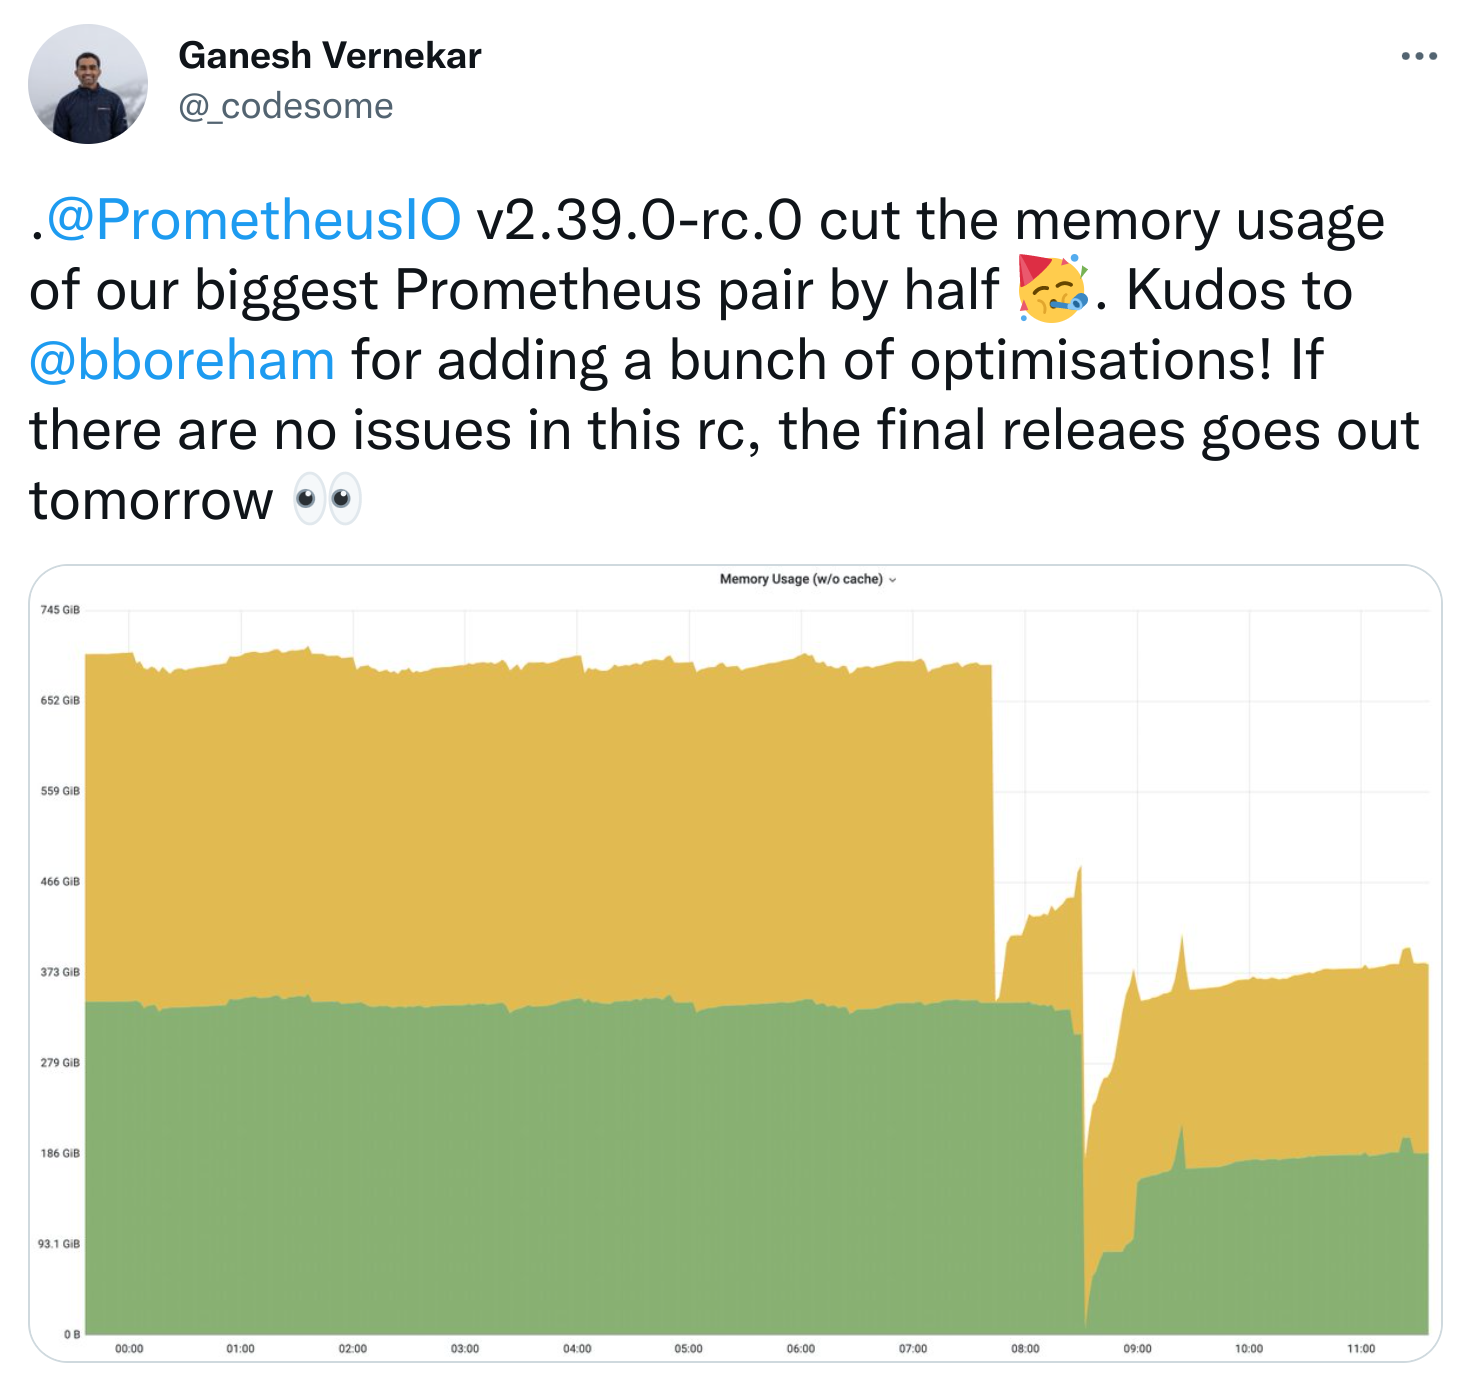
In a series of pull requests, Bryan Boreham went on another resource optimization spree through the Prometheus codebase. He improved the memory reuse in relabeling, optimized WAL replay handling, and removed unnecessary memory usage from TSDB head series, and turned off unnecessary transaction isolation for head compaction. While the real-world effect of this may vary a lot depending on your specific Prometheus usage, in one large use case at Grafana Labs it cut the Prometheus memory usage in half, as tweeted by Ganesh Vernekar:
It would be interesting to hear from others what impact they are seeing from these optimizations. Feel free to reply to Ganesh's tweet with your observations after deploying Prometheus 2.39!
Other enhancements
There are a lot of other improvements in Prometheus 2.39, such as new region metadata labels in the AWS EC2 and AWS Lightsail SD mechanisms, a metadata label for the Puppet SD that indicates the used Puppet query, allowing the copying of label matchers in the web UI when clicking on them in the expression browser's table-based time series output, and some smaller bug fixes. To see the full list of changes, check out the Prometheus 2.39.0 release changelog.
Conclusion
Prometheus 2.39 allows ingestion of out-of-order or older data, massively improves memory usage, and adds a few other features and bug fixes. Go try it out now!

Comments powered by Talkyard.