Let's talk about 6 common mistakes to avoid when getting started with Prometheus-based monitoring:
Mistake 1: Cardinality bombs
This is the classic pitfall that everyone hits at least once when they're starting out with Prometheus. Once you discover the usefulness of Prometheus' label-based data model, you might be tempted to split up metrics by all kinds of useful label dimensions, up to the point where you create way more time series than your Prometheus server can handle.
For example, you may have an HTTP server exposing a request counter that is split up by the HTTP method:
http_requests_total{method="POST"}
http_requests_total{method="GET"}
http_requests_total{method="PUT"}
http_requests_total{method="DELETE"}
This is totally fine, as long as you ensure that you only store valid method values in the method label. However, maybe now you get the idea to helpfully split up the metric by the ID of the requesting user as well:
http_requests_total{method="POST",user_id="1"}
http_requests_total{method="POST",user_id="2"}
http_requests_total{method="POST",user_id="3"}
[…many more…]
http_requests_total{method="POST",user_id="16434313"}

http_requests_total{method="GET",user_id="1"}
http_requests_total{method="GET",user_id="2"}
http_requests_total{method="GET",user_id="3"}
[…many more…]
http_requests_total{method="GET",user_id="16434313"}
[…many more…]
Assuming that you have more than a handful of users, you will now suffer a solid cardinality explosion that will blow up your Prometheus server's memory usage up to the point of an OOM (out-of-memory) crash.
So always keep in mind: every unique combination of labels on a metric automatically creates one time series that Prometheus will have to ingest, index, store, and process. While there's no absolute hard limit for the number of values you can put into a single label, you'll want to stay under the total budget of time series that your Prometheus server can handle. For example, a large Prometheus server might be able to handle up to a few million time series, so you'll want to choose the combination of your labels, the metrics they are on, and the number of targets exposing those metrics accordingly so you stay within your total budget of time series for that server.
In particular, you'll want to avoid storing unbounded high-cardinality values, like:
- Public IP addresses or email addresses
- Full HTTP paths, if these paths contain IDs or other unbounded cardinality information
- Process IDs (unless well-bounded to a specific set)
You can sometimes work around a high-cardinality issue with a label without removing it completely by reducing the cardinality of its values while still preserving the most useful information. For example, for HTTP paths of the form /api/users/739567637385/posts/28388445, you could at least replace the highest-cardinality components of the path (user and post IDs in this example) with placeholders in the final label value, to yield a more general pattern like /api/users/{user_id}/posts/{post_id} that generates way fewer different label values and thus time series.
Mistake 2: Aggregating away valuable labels in alerting expressions
A common temptation when writing alerting expressions that aggregate over an entire service is to aggregate away any labels that you don't immediately need to determine whether there is a problem or not. For example, if you wanted to determine if your service's overall error rate (across all label dimensions) was too high, you might write a rule like this:
sum(rate(errors_total{job="my-job"}[5m])) > 10By default, the sum() aggregator produces a single output series without any labels. This removes not only dimensions that you actually want to aggregate away (like the instance, type of error, etc.), but also all labels that are common across all input series and that may later prove useful for the routing or silencing of alerts in the Alertmanager. Especially the job label (or equivalent service grouping label) is a common routing label, since a job is often associated with a team responsible for handling its alerts. Thus I'd recommend preserving this label in aggregations whenever possible:
sum by(job) (rate(errors_total{job="my-job"}[5m])) > 10An even better option is to preserve any labels that you don't want to explicitly get rid of, by replacing the by() aggregation modifier with an exclude-list approach using the without() aggregation modifier:
sum without(instance, type) (rate(errors_total{job="my-job"}[5m])) > 10This way, any labels on the input series that you don't explicitly aggregate away will still be available in Alertmanager for alert aggregation and routing, as well as for your understanding of the origin of an alert.
Mistake 3: Using unscoped, "naked" selectors
When writing PromQL queries (especially for alerting!), you want to be extra careful about selecting data only from the job or service that you are intending to write the query for. Multiple unrelated services may expose the same metric name, potentially even with totally different semantic meanings. Even if this is not the case when you're initially writing your query, a new service with conflicting metric names may appear tomorrow that totally breaks your alerting rules or dashboards.
To avoid a situation where you accidentally pull in data for unrelated jobs, be sure to scope your selectors with label matchers that clearly namespace the job or service you are referring to. Usually, this would be the job label.
For example, an unsafe "naked" selector might select data with the same metric name from other jobs that you are not expecting:
rate(errors_total[5m]) > 10A safer scoped selector will limit the selected metrics to the ones coming from the my-job job:
rate(errors_total{job="my-job"}[5m]) > 10This way you can also avoid situations where your alerting rules or dashboards start misbehaving at a later point once another service is scraped that produces a metric name collision.
Mistake 4: No for duration in alerting rules
The for field in alerting rules allows you to specify for how long an output time series needs to be present across successive rule evaluation cycles for it to turn from a pending alert to a firing alert. This essentially allows you to add a per-series time tolerance to an alerting rule. Now you may wonder which alerts should have a for duration, and how long it should be. Is it maybe even a good idea to omit the for duration completely on most alerts?
Consider an alerting rule that uses the up metric to find targets that can't be scraped successfully, with the optional for modifier omitted:
alert: InstanceDown
expr: up == 0
A single failed scrape (which can happen quite easily) will cause this rule to fire. Usually you will want to make your alerting rules less trigger-happy and wait at least a couple of minutes to see if a problem persists before notifying a human:
alert: InstanceDown
expr: up == 0
for: 5m  # An instance needs to be down / unreachable for 5 minutes before creating an alert for it.
Specifying no for duration can even be problematic for alerting expressions that already have some time-averaging baked in. Consider this alert on high error rates:
alert: HighErrorRate
expr: rate(my_errors_total{job="my-job"}[5m]) > 10
This rule will fire on the first evaluation in which there is a high error rate, as averaged over a 5-minute period of available data. While the 5-minute averaging already introduces some robustness, consider what happens when the Prometheus server is completely fresh or has not collected data for a while:
- The 5-minute
rate()window will only consider a few very recent samples, not actually averaging over five minutes worth of data. - The rule can now produce immediately firing alerts for series that don't even have five minutes worth of data yet.
Introducing a for duration fixes this problem:
alert: HighErrorRate
expr: rate(my_errors_total{job="my-job"}[5m]) > 10
for: 5m
Similar arguments could be made about most alerting rules. So to make your alerting rules more robust, you will almost always want to set the for duration to at least a couple of minutes. Just keep in mind that this also leads to slower reaction times for alerts, so finding a balance for the for time tolerance is important.
Mistake 5: Too short rate() windows
Have you ever been frustrated by gappy or completely empty graphs when computing rates over too short time windows, like rate(my_counter[1m])? rate() and other PromQL functions (like increase(), irate(), deriv()) that tell you how fast a time series is going up or down over a given time window all need at least two samples under the input time window to be able to tell you how the series is developing between those two samples. If you make the time window too small, you risk just having one or zero samples under the window, in which case the output will become empty.
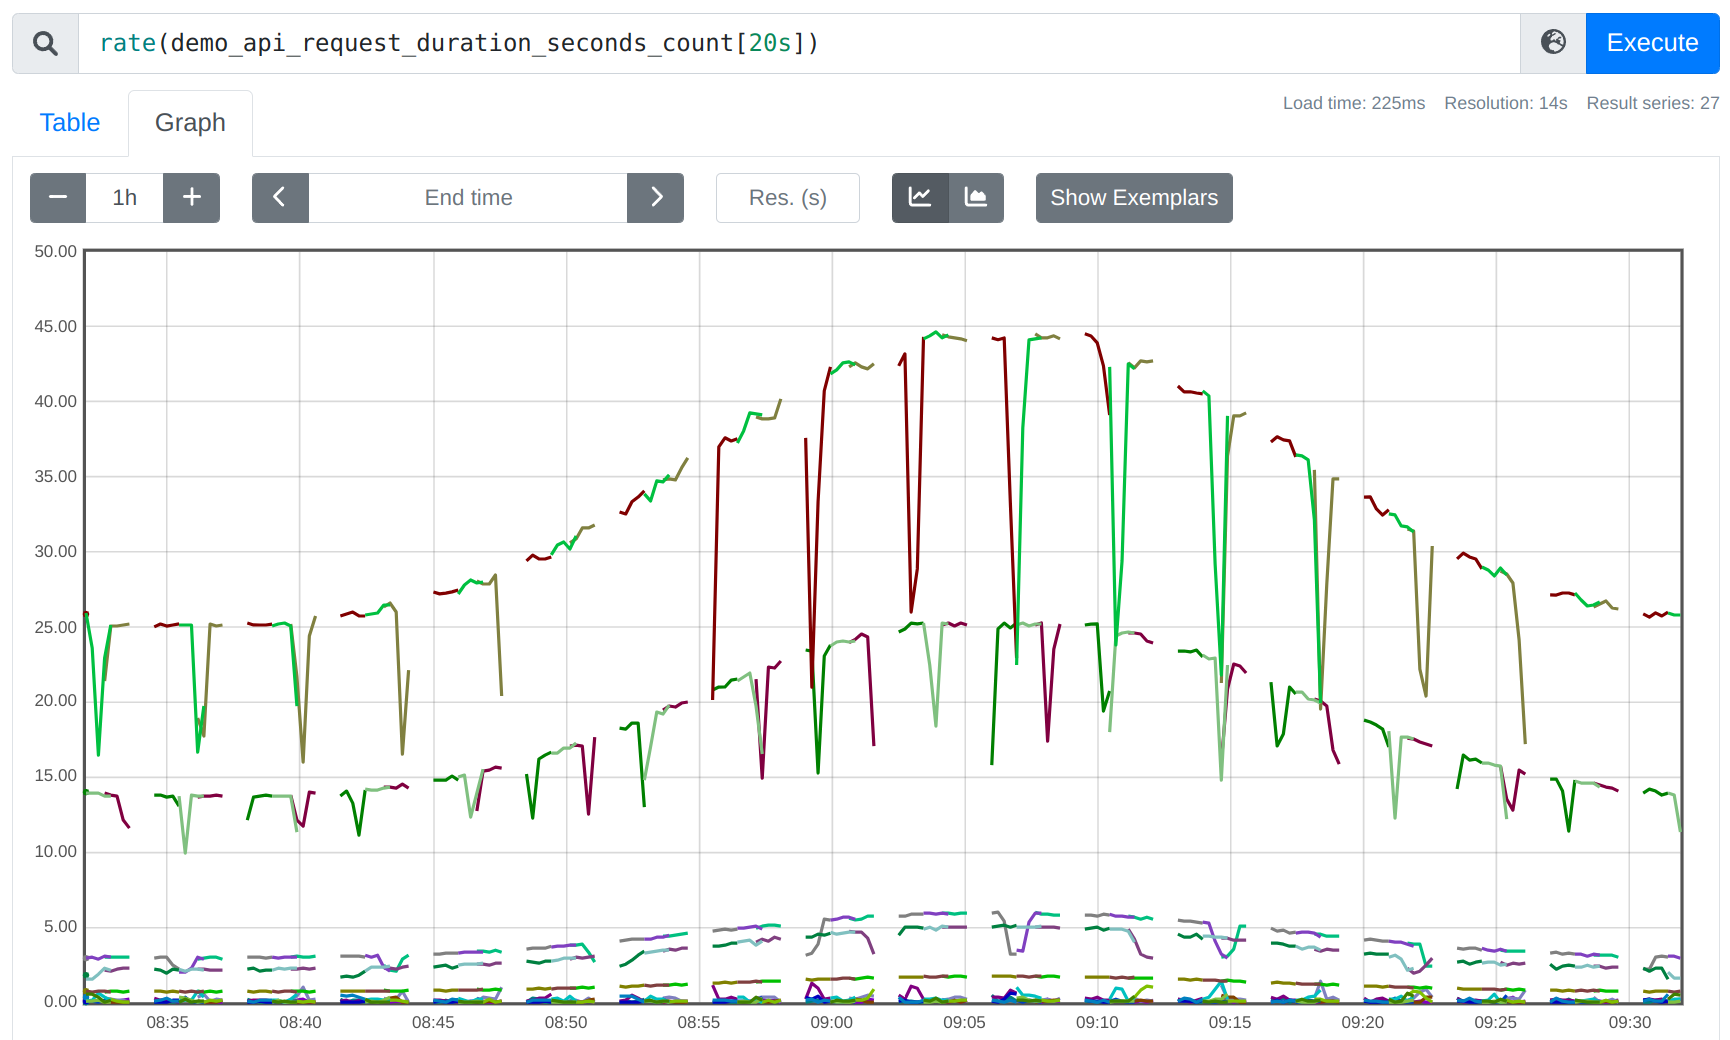
For example, if you take the 20s-ranged rate() of a counter metric that is scraped every 15s, there's a good chance that those 20s will often not cover two samples, so you get a gappy rate:
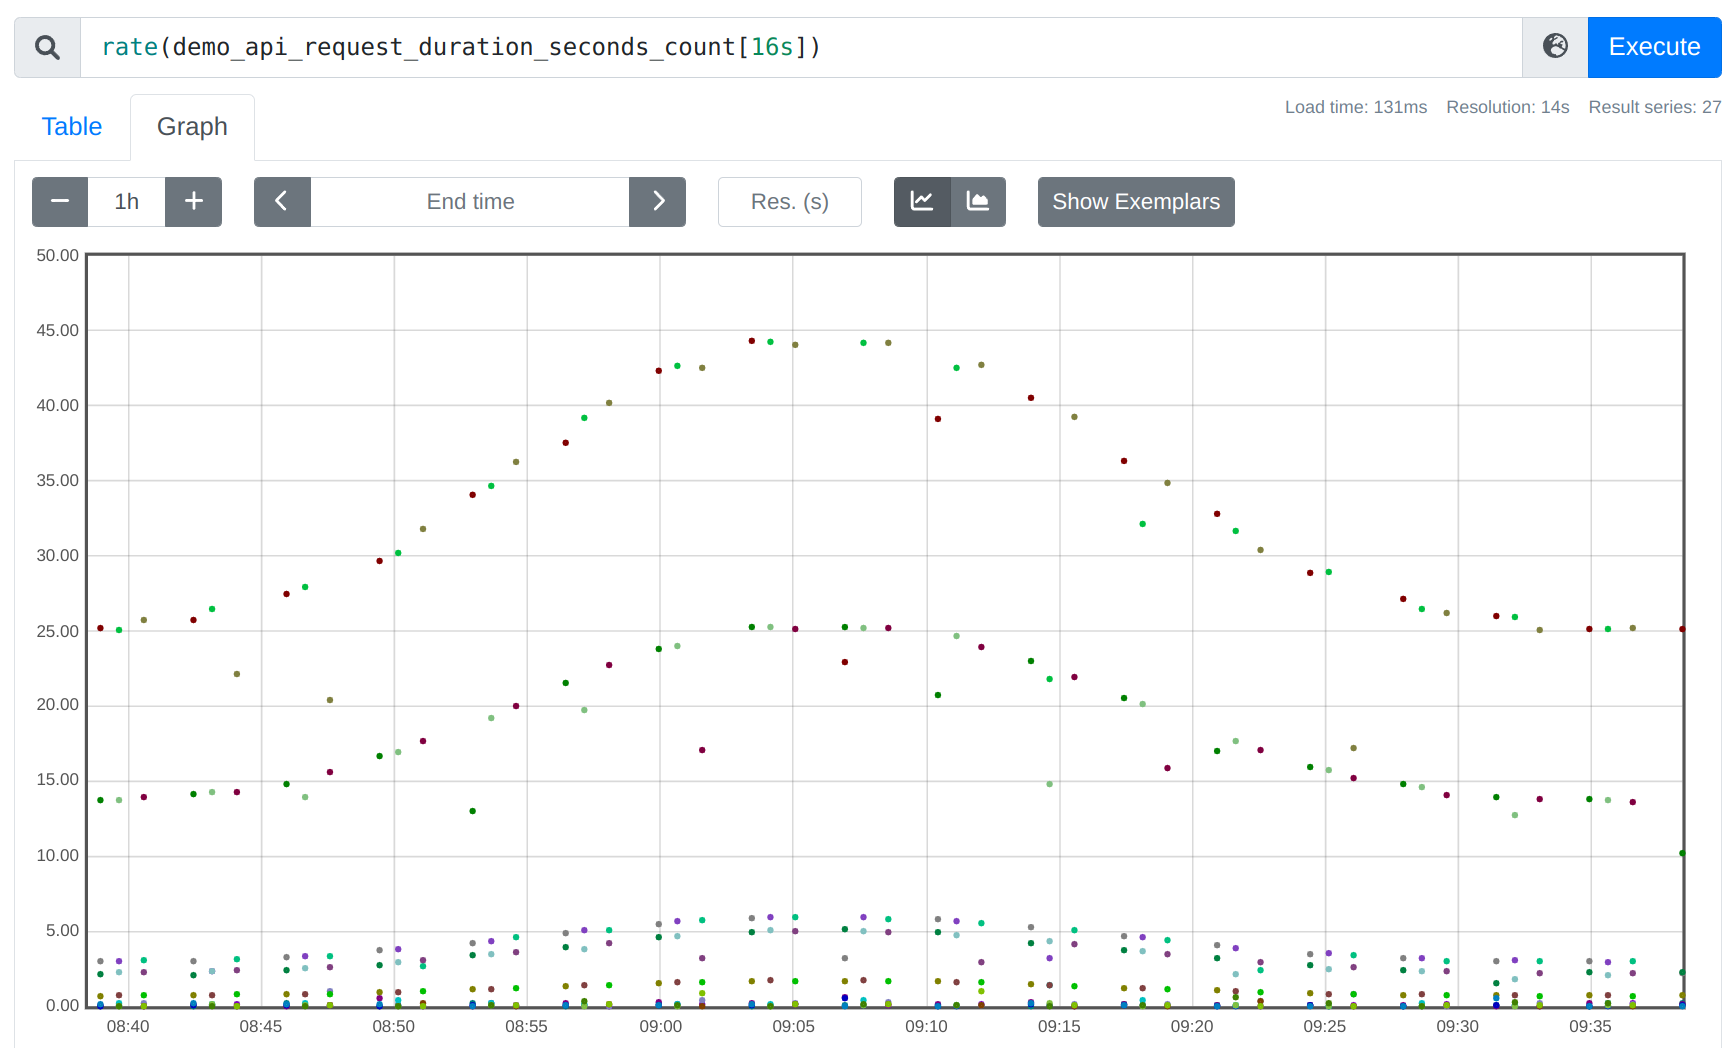
Taken to the extreme: if you decrease the rate window to 16s, you only get an output point very occasionally, when two 15s-apart points happen to fall under an arbitrarily aligned 16s window:
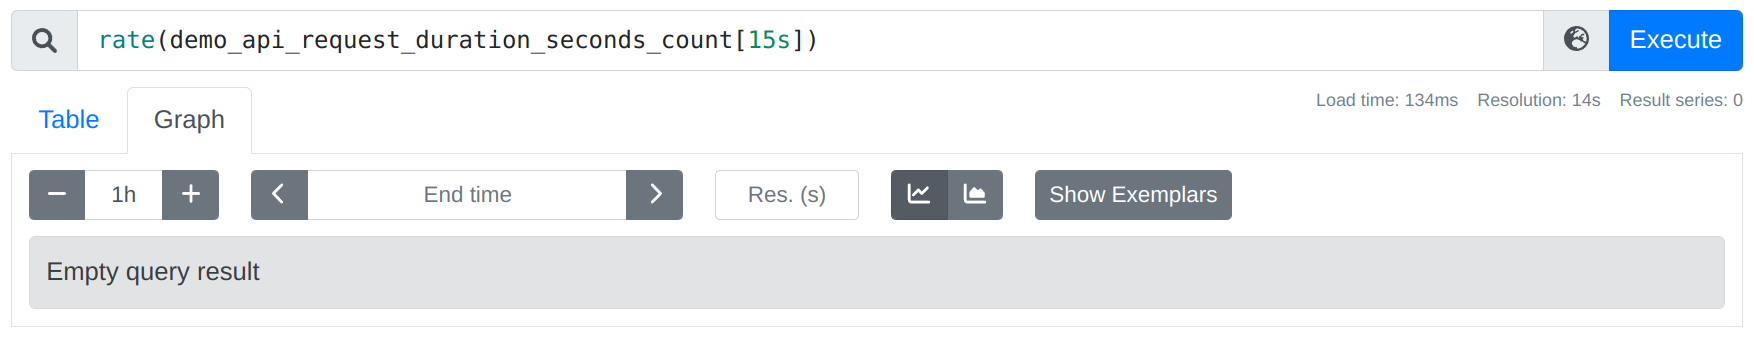
If you decrease the window further, you end up having no chance at all of covering two samples, so you get a completely empty query output:
So you'll want to choose your input windows large enough – not just 2x the scrape interval, but you'll also want to be robust in the face of occasional scrape failures and unlucky window alignments. It's generally a good practice to choose rate window sizes to be at least 4x the scrape interval:

Hint: When using Grafana, you can also use the $__rate_interval template variable to automatically choose a safe interval for you.
Mistake 6: Using rate() and friends with the wrong metric type
While PromQL is statically typed in some other ways, it cannot directly tell you if you're passing in the wrong type of metric into a function that is not designed to deal with it. The most prominent examples of this are:
Using rate() with gauge metrics
The rate(), irate(), and increase() functions are designed to only work with counter metrics. Counters are metrics that track cumulative counts that only ever go up (and never down), except for the occasional reset to 0 whenever the tracking process restarts. To neutralize away counter resets as much as possible in the rate calculation, these functions try to interpret any decrease in the sample values under the provided time window as a reset and compensate for it (see also our detailed article about rate calculations on this). This counter reset detection and compensation means that you will only ever get positive results (or 0) out of these functions. If you accidentally pass in a gauge metric that can naturally go up and down (like memory usage), PromQL will not be able to tell this mistake, but will simply return an incorrect output value. This is because every time that your gauge metric goes down, rate() will interpret this as a counter reset and will incorrectly "correct" for it.
Using deriv() with counter metrics
You can think of the deriv() function as roughly the equivalent of rate(), but for gauges. deriv() tells you how fast a gauge metric is going up or down per second, as measured over an input time window. While not as common, the same pitfall as with rate() can hit you the other way around here: since the deriv() function does not implement any logic around counter resets (gauges don't have these!), trying to calculate the deriv() of a counter metric will give you incorrect and sometimes even negative results whenever there is a counter reset under the provided window.
How can you avoid passing in incorrect metric types?
Since PromQL cannot automatically detect this kind of incorrect usage, unfortunately you just have to be extra careful when using these functions. Education helps here, but tools like the recently open-sourced PromLens query builder also use heuristics based on the metric name to try and guess whether you're passing in a wrong metric type:
Conclusion
Hopefully these tips were helpful for you on your journey of starting out with Prometheus! If you would like to learn Prometheus in a structured way and from the ground up, please also be sure to check out our self-paced training courses that cover the basics of Prometheus, as well as advanced use cases and integrations.
Related Content
We also made a video about these 6 mistakes:
Comments powered by Talkyard.