Have you ever encountered any of the following errors in your Prometheus server logs?
"Error on ingesting out-of-order samples""Error on ingesting samples with different value but same timestamp""duplicate sample for timestamp"
Then you likely have a misconfiguration in your setup that causes multiple series to collide and conflict with each other. In this post, we're going to explain the background behind these errors, what may cause them, and how to you can debug and fix them.
Background: The TSDB is (normally) append-only
Prometheus is a live monitoring system that usually only needs to keep track of metrics in a steadily ongoing way over time. The Prometheus TSDB reflects this by (normally) only supporting appends to the end of any existing series. That means that it rejects incoming samples that have an earlier timestamp than the latest one within the same series. It also rejects samples with the same timestamp as the latest one in their series when they have a different sample value (otherwise, they are ignored).

However, it is possible to misconfigure Prometheus in such a way that you get duplicated or out-of-order sample timestamps that Prometheus tries and fails to append to the TSDB. This is usually due to an accidental label set collision between multiple time series that causes the series to look the same (same metric name and label set), but it can have other reasons as well. When that happens, appends to the TSDB for the offending samples will fail, and Prometheus will log corresponding errors.
Side note: Prometheus 2.39 introduced an experimental out_of_order_time_window configuration setting that allows ingesting out-of-order samples within a limited time period, but this feature is not enabled by default. It can be useful in certain situations where not all data can be gathered live.
Underlying causes of sample timestamp errors
Let's have a look at the most common causes for these problems, along with the error messages they produce.
Duplicate targets
In a correctly configured Prometheus setup, every target has its own unique set of target labels. Prometheus attaches these labels to all series pulled from a target to help disambiguate otherwise identical metrics from different targets. But it's possible to misconfigure Prometheus in such a way that multiple targets share the same label set, which can cause label set collisions between the resulting time series. The TSDB will then see the streams of multiple original series as a single series, but reject invalid appends when their samples conflict with each other with out-of-order or duplicate timestamps.
Here's one way to easily provoke this duplication, by explicitly setting the job label of a target group to the same value as another job with an otherwise identical target in your prometheus.yml:
global:
  scrape_interval: 5s

scrape_configs:
- job_name: demo
  static_configs:
  - targets:
    - demo.promlabs.com:10000
- job_name: demo2
  static_configs:
  - labels:
      # Override the "job" label to also be "demo" instead of "demo2".
      job: demo
    targets:
    - demo.promlabs.com:10000
Another variant of the above could be achieved by adding target relabeling rules to the second scrape configuration and overriding the job label to "demo" that way.
When one of these duplicated targets starts scraping before the other one, but finishes the scrape last, you will get an "Error on ingesting out-of-order samples" error message, as the first target tries to insert its samples into the TSDB with a scrape timestamp before the second one that has already completed. As a full log line, that will look something like this:
ts=2022-12-14T12:21:05.833Z caller=scrape.go:1681 level=warn component="scrape manager" scrape_pool=demo target=http://demo.promlabs.com:10000/metrics msg="Error on ingesting out-of-order samples" num_dropped=254When two duplicated targets start scraping at exactly the same millisecond (which can and does happen between targets from different scrape pools), they will try storing their resulting samples with the same scrape timestamp. But one of these appends will fail with an "Error on ingesting samples with different value but same timestamp" error message:
ts=2022-12-14T12:18:10.841Z caller=scrape.go:1684 level=warn component="scrape manager" scrape_pool=demo target=http://demo.promlabs.com:10000/metrics msg="Error on ingesting samples with different value but same timestamp" num_dropped=58Usually the scrape_pool and target fields from the error message should be enough to point you at the right place in the configuration file to find and fix the conflicting targets. However, the duplication might not be visible in the configuration file itself, in case a remote service discovery mechanism produces duplicate targets, or there is an interaction between the service discovery source and target relabeling rules that leads to a loss of disambiguating labels. In that case, you may also want to take a look at the /targets page of your Prometheus server to spot identically labeled targets between multiple scrape pools or scrape configs (it's not possible to have identical targets in the same scrape pool, as Prometheus automatically deduplicates them into a single one). The /service-discovery page also shows all discovered targets with their label sets before and after relabeling. To fix the ingestion errors, make sure that all targets are labeled uniquely.
Buggy client-side timestamps
Usually Prometheus /metrics endpoints will not include explicit timestamps for the samples they expose. Instead, Prometheus assigns its own scrape start timestamp to all pulled samples. However, it's also possible to provide explicit client-side timestamps for samples in the Prometheus metrics exposition format. For example, if you wanted to expose a test_metric metric with a value of 42 and a milliseconds Unix timestamp of 1671021749332, the exposition format would read:
# HELP foo A test metric with an explicit timestamp.
# TYPE foo gauge
test_metric 42 1671021749332
Given the TSDB restrictions mentioned initially, there is a lot that can go wrong here if that feature is misused or incorrectly implemented: if a client-side timestamp moves backwards between scrapes, you will get an out-of-order error. If it stays the same, but the sample value changes, you will get a duplicate timestamp error.
The error messages in this case will look similar to the ones for duplicate targets, as they both originate in the scrape layer. However, the simple target information from the error logs may not be enough anymore to find the specific problematic metric within the broken target. Luckily, setting the --log.level=debug flag on the Prometheus server increases logging verbosity such that you can see each series (in the series log message field) that is causing trouble.
For duplicate timestamps, that will look like this:
ts=2022-12-14T10:23:40.297Z caller=scrape.go:1730 level=debug component="scrape manager" scrape_pool=prometheus_dupe target=http://demo.promlabs.com:10000/metrics msg="Duplicate sample for timestamp" series=go_goroutinesAnd for out-of-order timestamps, like this:
ts=2022-12-14T13:12:45.844Z caller=scrape.go:1725 level=debug component="scrape manager" scrape_pool=demo target=http://demo.promlabs.com:10000/metrics msg="Out of order sample" series=go_goroutinesIn this case, you will have to fix the metrics exposition in the broken target to resolve the problem.
Duplicate series from rules
It is also possible to create colliding series between the outputs of multiple recording rules. Take this rule file example, which records the metric colliding_name from two rules in the same rule group, but with different sample values:
groups:
- name: dupe
  rules:
  - record: colliding_name
    expr: 0
  - record: colliding_name
    expr: 1
Although the evaluation of multiple rules from the same group happens sequentially, Prometheus will run them all with the same query evaluation timestamp. This causes the rule evaluation to fail with a "duplicate sample for timestamp" error:
ts=2022-12-15T10:07:25.976Z caller=manager.go:684 level=warn component="rule manager" file=dupes-rules.yml group=dupe name=colliding_name index=1 msg="Rule evaluation result discarded" err="duplicate sample for timestamp" sample="{__name__=\"colliding_name\"} => 1 @[1671098845972]"This error also helpfully logs the rule group, the recorded metric name, as well as the offending label set of the sample. That way, you should be able to fix the problem in your rule files.
As a variation, it is also possible for such a collision to happen between series produced from a recording rule and a target scrape.
Remote write sending bad data
If you are using the Prometheus server's own remote write receiver to push samples to Prometheus, you can also run into situations where one or multiple push sources can send conflicting metrics and timestamps. In that case, you may get an "Out of order sample from remote write" or "duplicate sample for timestamp" request error on the sending side:
ts=2022-12-15T10:49:51.792Z caller=dedupe.go:112 component=remote level=error remote_name=45e379 url=http://localhost:9090/api/v1/write msg="non-recoverable error" count=6 exemplarCount=0 err="server returned HTTP status 400 Bad Request: out of order sample"Or:
ts=2022-12-15T10:51:31.437Z caller=dedupe.go:112 component=remote level=error remote_name=45e379 url=http://localhost:9090/api/v1/write msg="non-recoverable error" count=3 exemplarCount=0 err="server returned HTTP status 400 Bad Request: duplicate sample for timestamp"And in the receiving Prometheus server, you will get a similar error message (once a fix for a bug that we discovered in the course of writing this article has been fixed):
ts=2022-12-15T11:04:23.006Z caller=write_handler.go:107 level=error component=web msg="Out of order sample from remote write" err="out of order sample" series="{__name__=\"foo\", instance=\"localhost:8080\", job=\"remote\"}" timestamp=1671102261810This latter message tells you the exact offending series, so you can hopefully track down and fix its source.
Intentional ingestion of out-of-order data
Now, there are a few valid use cases when you might actually want to ingest out-of-order data or even data that is normally too old to be ingested into the TSDB at all. You may have some data sources that cannot produce metrics on an ongoing live basis, but only deliver batched or otherwise delayed results. For these cases, as mentioned above, you will want to turn on Prometheus' new experimental out_of_order_time_window TSDB configuration setting that allows ingesting out-of-order samples within a limited time period to get rid of these error messages.
Caution: Not all collisions cause errors!
As we just learned above, there are multiple series collision conditions that Prometheus can notice and tell us about. But in some cases, Prometheus silently ignores series collisions or can't detect them at all. So not seeing an error is not a guarantee that everything is working right.
Silent failure of collisions caused by metric relabeling
One such case is when accidentally using metric relabeling (which is applied to each pulled series during a scrape) to remove important disambiguating labels of series from a single target. For example, the following configuration removes the quantile label from all pulled metrics, but in the go_gc_duration_seconds metric, this label is required to tell 3 different series apart:
global:
  scrape_interval: 5s

scrape_configs:
- job_name: prometheus
  static_configs:
  - targets:
    - localhost:9090
  metric_relabel_configs:
  - action: labeldrop
    target_label: quantile
The current behavior of Prometheus is to store the first of the conflicting samples, but silently discard the subsequent ones without any warning. We filed an issue about possibly reviewing and/or fixing that behavior.
Two rules or targets writing into the same series without timing conflicts
It can easily happen that Prometheus either scrapes two duplicate targets or ingests samples from two rules writing to the same series, but the samples always arrive in perfect lockstep without creating an out-of-order condition or a duplicate timestamp. In that case, the samples from the two sources will be written to the same time series, with the same value altering back and forth between both input series.
For example, if you created a rule file like this, recording the metric colliding_name both with a sample value of 0 and 1:
groups:
- name: collision
  rules:
  - record: colliding_name
    expr: 0
- name: collision2
  rules:
  - record: colliding_name
    expr: 1
...then you will likely not see any logged errors (unless the two rule groups happen to run at the exact same duplicate timestamp). However, you will see the sample value of the series alternating between 0 and 1:
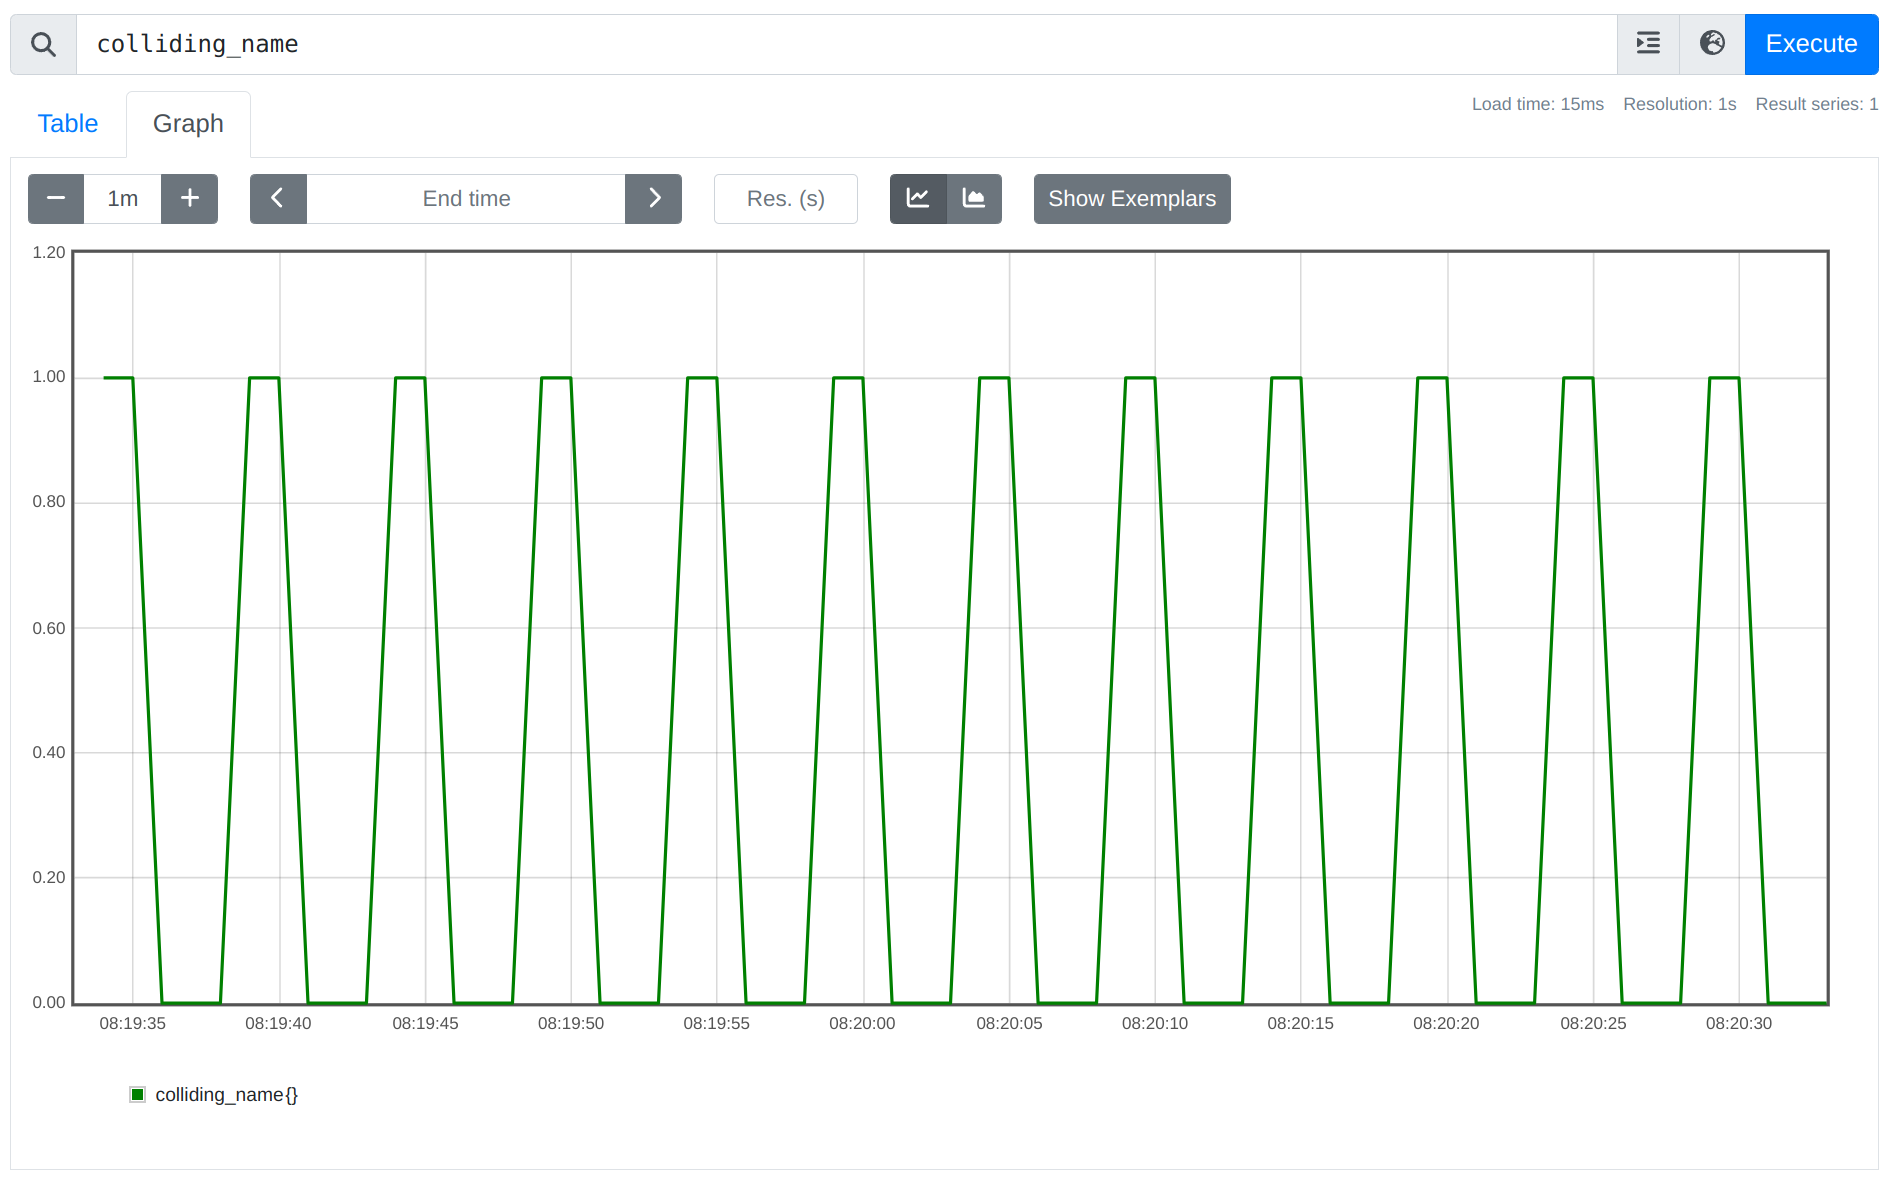
There's usually no valid use case for this kind of behavior, but it's currently not possible for Prometheus to detect this case automatically.
Detecting these issues using metrics
Besides reading logged error messages, you can also detect out of order and duplicate timestamps by monitoring the following metrics that Prometheus exposes about itself:
prometheus_tsdb_out_of_order_samples_total: The total number of out of order samples ingestion failed attempts due to out-of-order support being disabled.prometheus_target_scrapes_sample_duplicate_timestamp_total: The total number scraped samples with duplicate timestamps.prometheus_target_scrapes_sample_out_of_order_total: The total number of scraped out-of-order samples.prometheus_http_requests_total{code="400",handler="/api/v1/write"}: The total number of400status code requests received by the remote write receiver (in the receiving Prometheus server). This can include errors that result in a400as well.prometheus_remote_storage_samples_failed_total: The total number of samples that failed to be sent over remote write in the sending Prometheus server. This can also include other errors.
Series collision errors from rule evaluations unfortunately do not show up in a metric yet. There is a prometheus_rule_evaluation_failures_total metric, but that only counts total failures of a rule's evaluation, not individual series that have been discarded during the evaluation. However, a rule with problematic output series will still be marked as unhealthy, and the /rules page will show you the corresponding error:
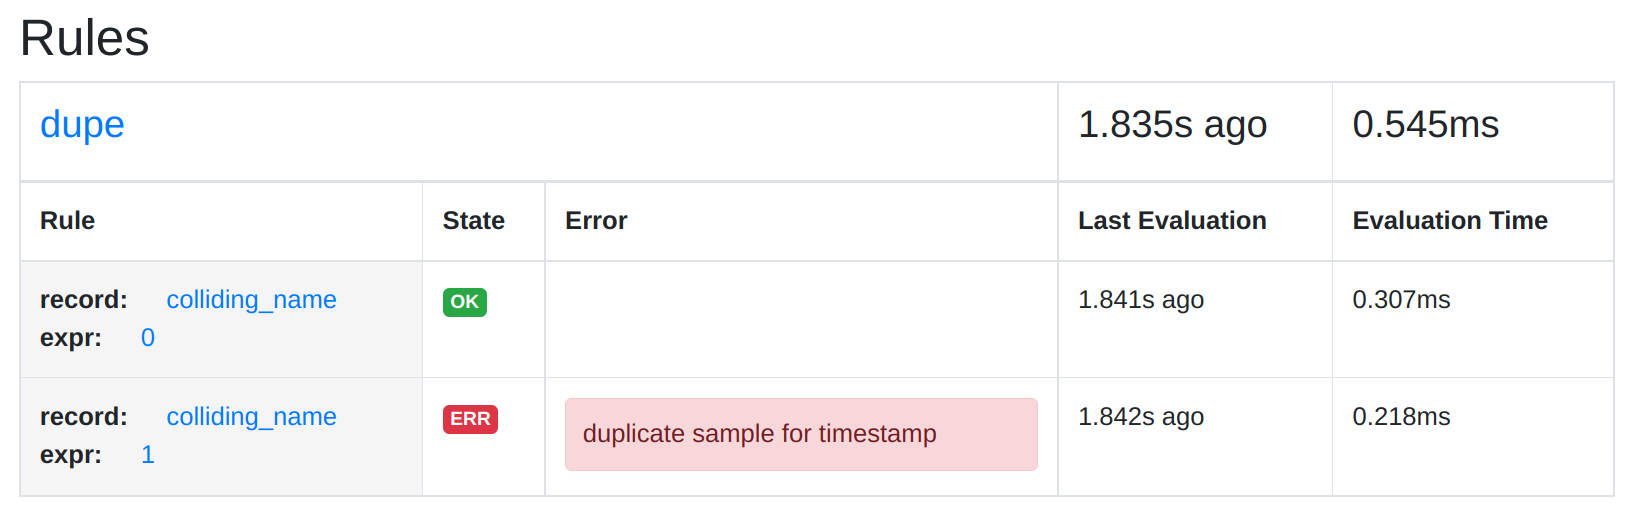 .
.
Other storage errors
Besides out-of-order and duplicate sample timestamps, the Prometheus TSDB can also respond with a set of other errors when trying to append samples or even exemplar data. You can see all possible errors in the Prometheus storage code.
Conclusion
Hopefully these explanations were useful for understanding the background behind these out-of-order and duplicate sample ingestion errors and can be helpful in finding and fixing them the next time they occur in your Prometheus setup.
If you would like to learn Prometheus in a structured way and from the ground up, please also be sure to check out our self-paced training courses that cover the basics of Prometheus, as well as advanced use cases and integrations.
Comments powered by Talkyard.